
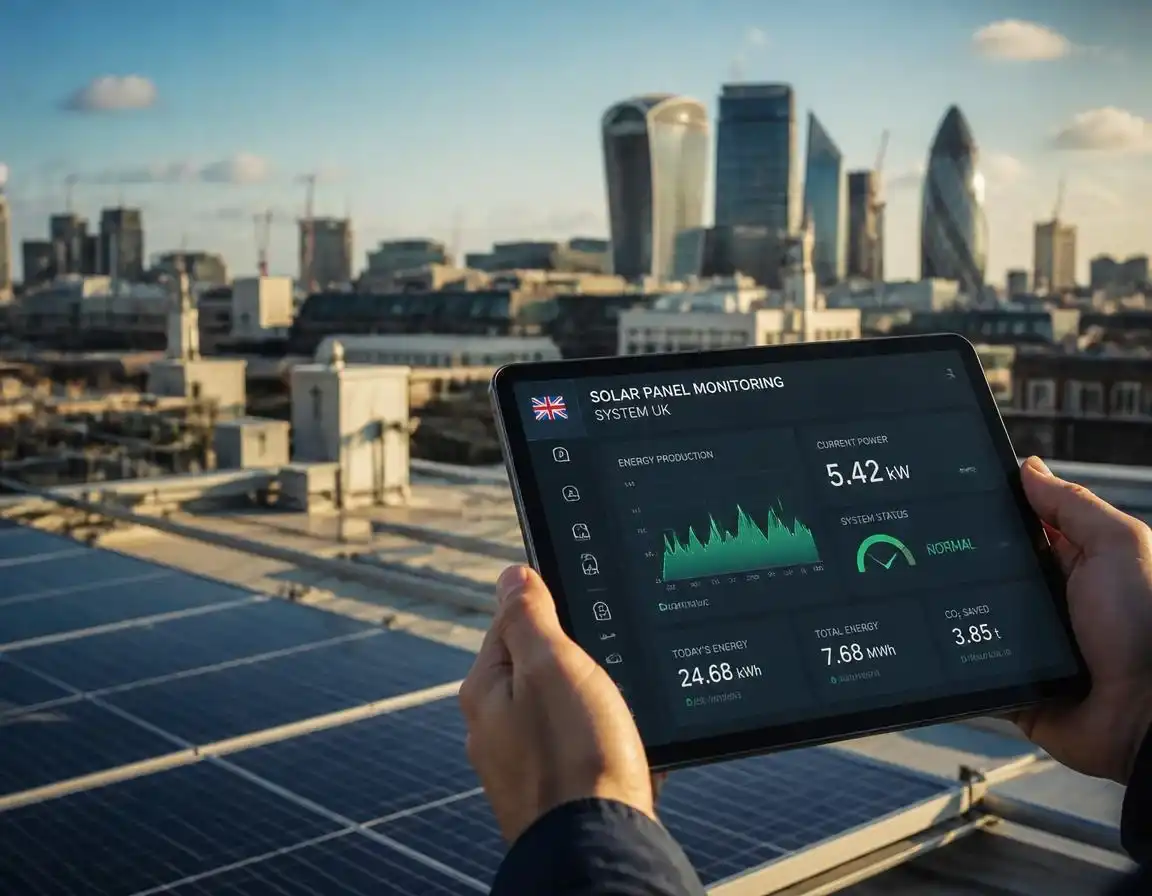
Solar Panel Monitoring System UK

Solar Panel Monitoring System UK:
The Complete 2026 Guide
You’ve invested thousands in solar panels. But are they actually performing as they should? Here’s your no-nonsense guide to tracking, optimising, and earning more from your system — in plain English.
What Is a Solar Panel Monitoring System?
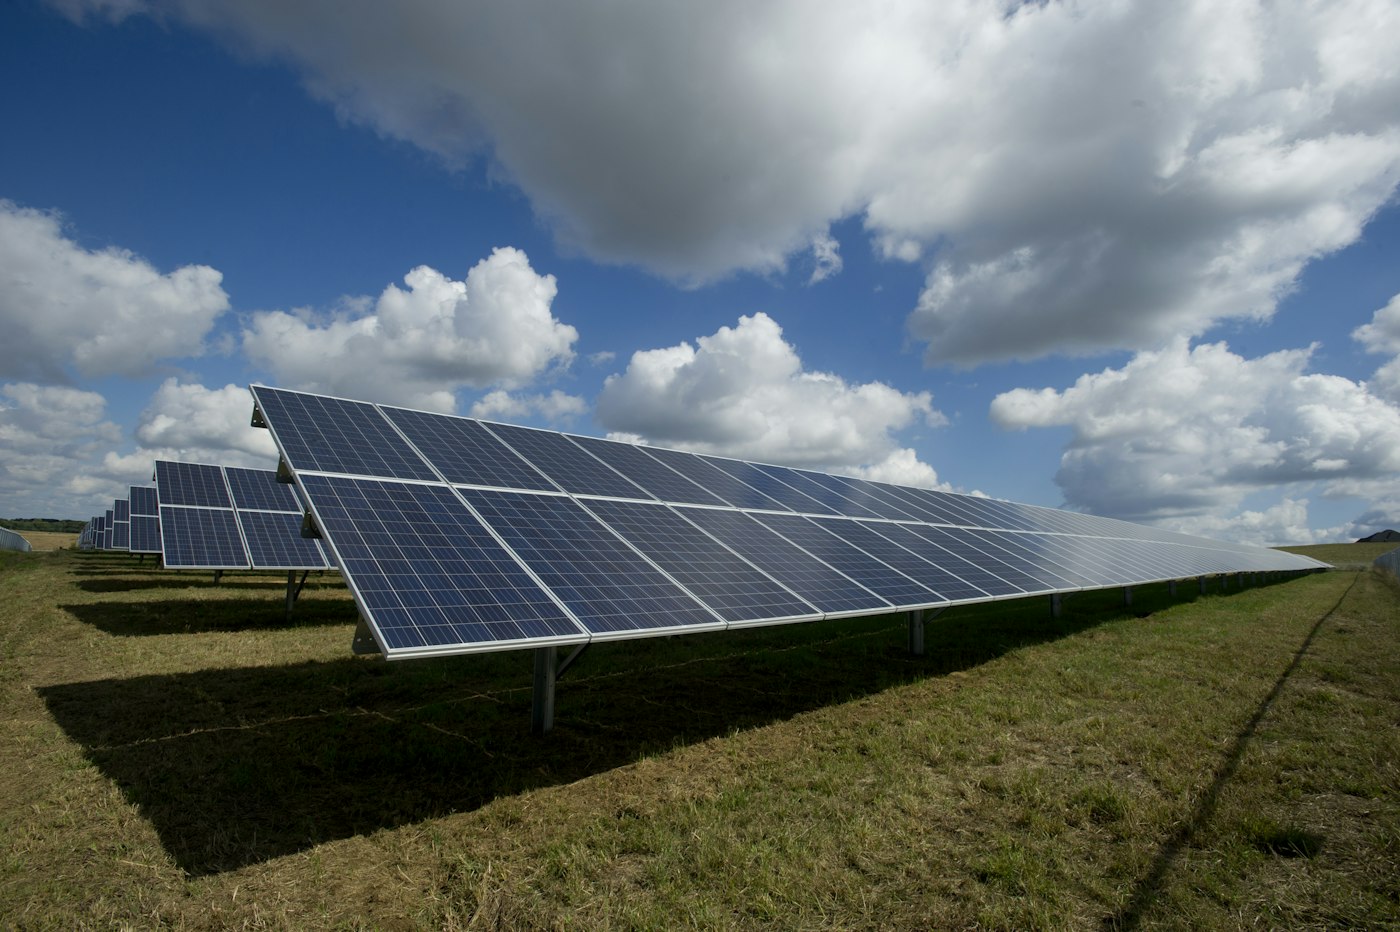
Let me give it to you straight. A solar panel monitoring system is the combination of hardware and software that tells you exactly what your solar setup is doing at any given moment. We’re talking real-time generation figures, how much electricity your home is consuming, what you’re exporting to the grid, and — if you’ve got a battery — how full it is right now.
Without monitoring, you’re essentially guessing. Your panels could be underperforming due to a faulty connection, a pigeon nesting under one panel, or a shading issue that’s crept in as a nearby tree grew — and you’d have no idea. Panels fail silently. No alarm, no flashing light. They just quietly stop contributing to your energy bills.
Most modern systems in the UK work like this: your inverter (the box that converts DC power from your panels into usable AC electricity) collects performance data and sends it to the manufacturer’s cloud platform via your home Wi-Fi. You then check it all through a free smartphone app or web browser.
Your inverter collects generation & consumption data and sends it wirelessly to your monitoring app — free, in real time.
Why Monitoring Actually Matters
I’ll be honest — when I first got solar fitted, I thought monitoring was a bit of a nice-to-have. It took exactly one month of checking my app daily to change my mind completely. The data genuinely changes how you behave at home, and it protects your investment.
Here’s the thing: a single underperforming panel can quietly cost you between 200–600 kWh of generation annually. At current rates, that’s up to £148 in lost savings per year — silently draining the return on your investment. Catch it early with monitoring, and a call to your installer sorts it within days.
Beyond fault detection, monitoring lets you understand your self-consumption — the overlap between when you’re generating solar electricity and when you’re using it. This is where the biggest financial gains live, because using your own solar electricity saves you 24.67p/kWh, whereas exporting to the grid earns just 3–15p/kWh under the Smart Export Guarantee. The gap is significant.
Types of Solar Monitoring Systems Available in the UK
There’s no single “best” monitoring system — it depends largely on what kind of inverter you have installed. Here’s a breakdown of the main options and how they compare:
| Type | How It Works | Panel-Level Data | Typical Cost | Best For |
|---|---|---|---|---|
| String Inverter Monitoring | Tracks whole-system output via a single central inverter | ✗ No | Free | Simple, south-facing, unshaded roofs |
| Microinverter Monitoring | Each panel has its own inverter — data reported per panel | ✓ Yes | £200–£500 extra | Shaded, complex, or multi-orientation roofs |
| Power Optimiser Monitoring | Per-panel optimisers feed data to a central string inverter | ✓ Yes | £100–£300 extra | Partially shaded roofs — middle-ground option |
| Aftermarket / Clamp Monitor | Add-on hardware clamps onto your meter cables | ✗ Usually not | £50–£300 | Any system, any inverter brand |
| Smart Meter Apps | Apps like Loop or Hugo pull data from your smart meter | ✗ No | Free | Basic import/export tracking only |
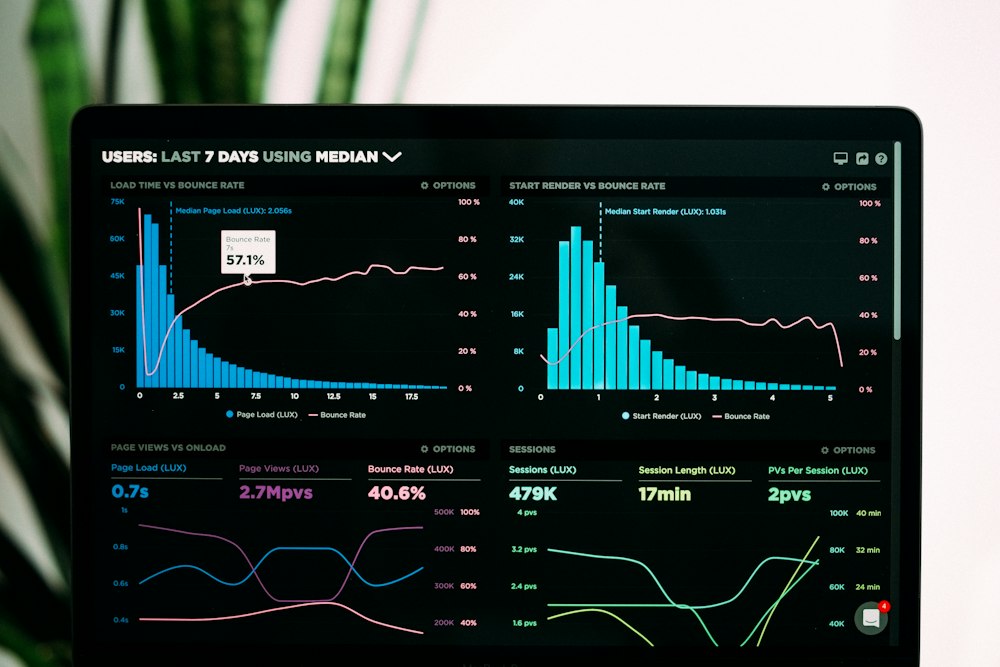
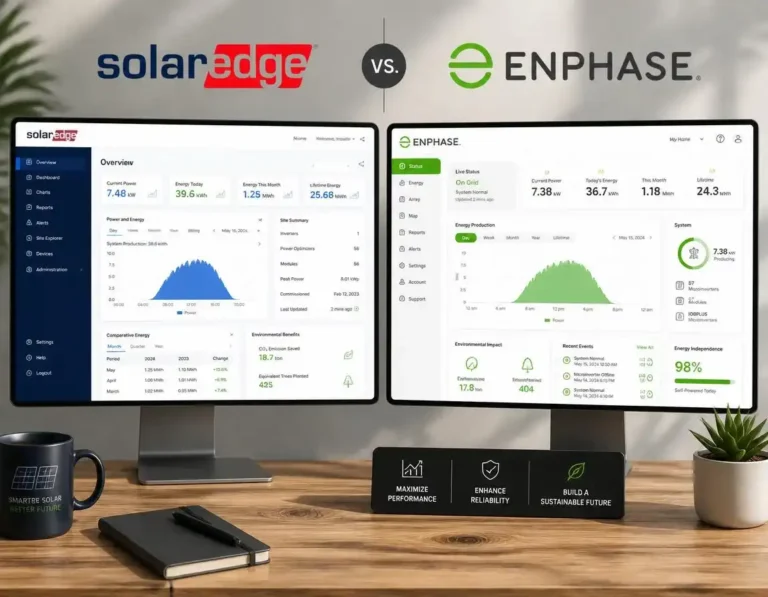
Modern solar monitoring dashboards give you real-time generation, consumption, battery levels, and SEG export data in one clear view.
Best Solar Monitoring Apps in the UK — 2026 Comparison
The app you’ll use is almost always determined by your inverter manufacturer. The good news is that the main options are all free to download and use. Here’s how they stack up in 2026:
| App / Platform | Inverter Brand | Panel-Level | Battery Control | Cost | Our Take |
|---|---|---|---|---|---|
| Enphase Enlighten | Enphase IQ8 microinverters | ✓ | ✓ | Free | Best Overall |
| mySolarEdge | SolarEdge + optimisers | ✓ | ✓ | Free | Panel-Level Pick |
| SolisCloud | Solis string & hybrid | ✗ | Partial | Free | Reliable, No Frills |
| Fronius Solar.web | Fronius inverters | ✗ | ✗ | Free (basic) / Paid (history) | Watch the Paywall |
| Growatt ShinePhone | Growatt hybrid inverters | ✗ | ✓ | Free | Good for Hybrids |
| Solar Analytics | Most inverter brands | Partial | ✗ | ~£3–£5/month | Brand-Agnostic Option |
| Loop / Hugo | Any (via smart meter) | ✗ | ✗ | Free | Import/Export Only |
What Should Your Solar Monitoring System Actually Show You?
A basic monitoring app will tell you how much you’ve generated today. That’s a starting point, but it’s not enough to really optimise your system. Here are the four energy streams you need visibility on:
The sweet spot — known as self-consumption — is where your generation overlaps with your home’s demand. Every kWh you use directly from your panels saves you buying from the grid. The best monitoring apps display this as a live energy flow diagram or daily pie chart, making it easy to spot patterns and shift behaviour accordingly.
Solar Monitoring & the Smart Export Guarantee (SEG)
Here’s something that genuinely surprises a lot of solar owners I speak to: monitoring data and your Smart Export Guarantee earnings are more closely linked than most people realise.
To receive SEG payments at all, you need a smart meter capable of recording half-hourly export readings. But choosing the right SEG tariff — and knowing how much you’re actually exporting — requires good monitoring data. Without it, you’re just hoping for the best.
Using solar electricity yourself always saves more than exporting it. But the right SEG tariff still adds £150+/year compared to a poor one.
As of March 2026, there are 50 SEG tariffs across 11 suppliers. The best fixed rates pay roughly five times more than the lowest offerings on the market. On a typical 4kW system, that difference alone is worth over £150 per year, just from picking the right tariff. Rates shift every few months, so it’s worth checking our regularly updated SEG tariff comparison rather than going on last quarter’s numbers.
Want to see what your own roof could actually earn? Our free SEG Income Estimator models your export income against today’s tariffs in a couple of minutes — handy alongside your monitoring data.
In 2023–2024 alone, £30.7 million was paid out to UK solar owners through the SEG — a 327% increase on the previous year. Good monitoring means you’re in the best position to claim your share.
How Much Does Solar Panel Monitoring Cost in the UK?
Here’s the part most people are pleasantly surprised by: for the vast majority of UK homeowners, monitoring costs nothing at all. Your inverter app is free. That said, there are paid tiers if you want more granular data or brand-agnostic analytics.
| Monitoring Option | Examples | Cost | What You Get |
|---|---|---|---|
| Inverter App (Built-in) | Enphase Enlighten, SolisCloud, mySolarEdge, ShinePhone | Free | Real-time generation, daily/weekly history, alerts, battery status |
| Smart Meter App | Loop, Hugo | Free | Import/export data from your smart meter — basic but useful |
| Plug-In / Clamp Monitor | Efergy, Emporia Vue | £50–£150 | Whole-home usage tracking, works with any inverter brand |
| Advanced Add-On Monitor | Sense, Voltaware | £150–£300 | Appliance-level breakdown, AI usage insights, solar integration |
| Third-Party Analytics | Solar Analytics | ~£3–£5/month | Brand-agnostic, actual vs expected output comparisons, fault alerts |
| Pro-Grade / MCS-Compliant | Commercial monitoring suites | £500–£1,500 | Full compliance data logging, remote professional monitoring |
Not sure what size system you’re actually working with yet? Our free Solar Panel Calculator works out your roof’s potential output in under a minute — useful context before you decide how much to spend on monitoring hardware.

Setting up solar monitoring is straightforward — most inverter apps are configured during installation and need just a Wi-Fi connection to start sending data.
How to Set Up Your Solar Monitoring System
Your installer should configure monitoring during commissioning, but it’s worth understanding the process yourself — especially if your Wi-Fi signal drops and data disappears. Here’s how it typically works:
Your inverter needs a reliable Wi-Fi signal to send data to the cloud. If it’s in a loft or garage with a weak signal, a simple Wi-Fi extender (around £20–£40) solves this instantly.
Search for your inverter brand in the App Store or Google Play — Enphase Enlighten, mySolarEdge, SolisCloud, Growatt ShinePhone, Fronius Solar.web. All are free.
You’ll need the inverter serial number (printed on the unit) or a QR code your installer provided. The setup wizard walks you through the rest in around five minutes.
On a clear day, a 4kW system should show 2–3.5kW of output around solar noon. If you’re seeing zero or very low figures on a sunny day, there’s something worth investigating.
Compare SEG rates, choose a supplier, and apply directly via their website. You’ll need your MCS certificate number and smart meter MPAN. The process takes around 15–30 minutes.
3 Tips to Earn More From Your Solar Monitoring Data
1. Shift Your Heaviest Appliances to Peak Solar Hours
Use your monitoring app to find your peak generation window — typically 11am to 3pm on most UK days. Schedule your washing machine, dishwasher, and EV charger to run during those hours. You’ll use free solar electricity instead of buying it at the current Ofgem price cap rate of 24.67p/kWh from the grid. Over a year, this simple habit shift can add £80–£200 to your effective savings.
2. Compare Your Actual Output Against Expected Output
Most apps show a daily generation figure. Compare it against what your system should be producing given the weather conditions. A consistent shortfall of 15% or more on clear days suggests a fault worth investigating. Third-party apps like Solar Analytics do this comparison automatically and flag anomalies for you.
3. Switch to the Best SEG Tariff — and Review It Every Year
SEG rates change frequently, and the difference between suppliers is enormous — see our regularly updated SEG tariff comparison for who’s paying the most right now. Use your monitoring data to see how much you’re exporting monthly, then decide whether switching tariff is worth it. Switching is free, takes about 20 minutes, and can be done independently of your energy import supplier.
| SEG Supplier | Rate (2026) | Tariff Type | Est. Annual Income (4kW)* |
|---|---|---|---|
| Octopus Outgoing | 15p/kWh | Fixed | £294–£368 |
| OVO Energy | 15p/kWh | Fixed | £294–£368 |
| E.ON Next | 15p/kWh | Fixed | £294–£368 |
| Scottish Power | 12p/kWh | Fixed | ~£159 (3.5kWp avg) |
| Octopus Agile Export | Variable (up to 30p+) | Variable | Higher during peak periods |
| Lowest tariffs available | ~3p/kWh | Fixed | ~£59–£74 |
*Based on 1,960–2,450 kWh annual export from a 4kW system. Rates verified April 2026 via Ofgem SEG register — always confirm current rates before applying.




7 Comments