MCS Performance Estimate: How to Read Your Solar Quote

How to Read the MCS Performance Estimate on Your Solar Quote (and Spot an Inflated Yield)
The short version
Every MCS-certified installer has to give you an estimated annual output in kWh. It’s worked out as system size (kWp) × a yield factor called Kk × a shade factor, and Kk comes from MCS tables for your postcode region, roof direction and pitch. Divide the kWh by the kWp and you get your implied yield. Most UK roofs land at 850–1,000 kWh per kWp a year, and a south-facing roof tops out at about 1,050. If your quote implies much more and can’t show its inputs, treat it as a sales pitch. Here’s how to check it in ten minutes.
The quote lands in your inbox at nine at night. Twelve pages of PDF, and on page five there’s a table promising your roof will generate 4,860 kWh next year, and every year after that. It feels precise. It feels official. It might even be both. Or it might be a template number nobody sanity-checked before hitting send.
I read a lot of solar quotes, and the MCS performance estimate is the single most useful line on the page. It’s also the easiest one to get wrong, sometimes deliberately and often by accident. Here’s how I read it, and how to catch an inflated yield before it becomes your problem.
What the MCS performance estimate actually is
MCS, the Microgeneration Certification Scheme, is the quality mark behind almost every domestic solar job in the UK. Install to its standards (MIS 3002 is the one covering solar PV design and installation) and you keep the door open to Smart Export Guarantee payments and most grant routes. Skip it and your system still works, but you can’t claim SEG payments unless it’s covered by an equivalent scheme such as Flexi-Orb.
Part of working to the standard is giving you an estimate of your system’s annual output before you sign. It isn’t a bespoke simulation with a hidden spreadsheet behind it. MCS sets out a standard method:
Kk is a yield factor in kWh per kWp, looked up from MCS tables using your postcode region, your roof’s orientation (degrees from south) and its pitch. An assumed performance ratio of 0.8 is already built into it, so heat, inverter and cable losses are covered. The shade factor runs from 1.00 (no shading) downwards, and comes from a shading survey. That’s all the estimate is, and it’s why it’s so easy to check.
Here’s what the estimate page looks like, using illustrative numbers for a south-facing Leeds semi:
| Line on the estimate | Example value | What to check |
|---|---|---|
| Installed capacity (kWp) | 4.00 | Matches panel count × panel watts on the quote |
| Postcode region | Your MCS zone | It’s your region, not head office’s |
| Orientation (degrees from south) | 0° | Matches your roof on a compass app |
| Inclination (pitch) | 35° | Matches your roof |
| Kk (kWh per kWp) | 880 | Plausible for your region and roof direction |
| Shade factor | 0.95 | Backed by a shading survey if below 1.00 |
| Estimated annual output | 3,344 kWh | 4.00 × 880 × 0.95 |
Two things the estimate is not. It isn’t a guarantee, because the weather doesn’t sign contracts, and it isn’t a measurement of any particular year. It’s a normalised forecast for an average one. An honest installer says so out loud. The MCS website publishes the standards installers work to, and I’ve written separately about what the MCS badge on a van should and shouldn’t reassure you about.
The five things to find on the estimate
1. System size, in kWp. Kilowatt-peak: panel count times panel wattage. It’s a capacity, not an energy amount. A 4.0 kWp array tells you nothing about your year until it meets your roof and your sky.
2. Postcode region, orientation and pitch. These three inputs choose your Kk. If any of them is wrong or missing, the estimate is decoration. Check them against your own roof.
3. Kk, in kWh per kWp. The yield factor itself. Because it already includes the 0.8 performance ratio, you shouldn’t see a separate “loss stack” that quietly takes another 20% off, and you shouldn’t see a yield far above the regional bands below.
4. The shade factor. 1.00 means no shading. Anything below should come with a shading survey (MCS uses a sunpath diagram). A chimney, a tree or a neighbour’s extension on your survey photos with a shade factor of 1.00 is a red flag.
5. Estimated annual generation and your implied yield. The headline kWh is what the salesperson quotes on the phone. Divide it by the kWp and you get kWh per kWp, which equals Kk × shade factor. That’s the number that lets you compare any two quotes on any roof in the country.
The 60-second sanity check
One division turns any quote into a comparable number, and that number has a ceiling set by British weather. Here’s how it plays out on four worked examples (illustrative, not real customers):
| Example | Size | Claimed kWh/yr | Implied kWh/kWp | Verdict |
|---|---|---|---|---|
| A: Leeds semi, south-facing | 4.0 kWp | 3,500 | 875 | Plausible for northern England (800–900) |
| B: the same Leeds semi | 4.0 kWp | 4,800 | 1,200 | Inflated: a third above the top of the band |
| C: Bristol bungalow, east–west | 5.0 kWp | 4,100 | 820 | Sensible for an east–west split in the South West (760–890) |
| D: Cornwall cottage, south, 35° | 4.0 kWp | 4,200 | 1,050 | Top of the band, only if the roof is unshaded |
Watch for “up to”
“Up to 4,800 kWh” is not an estimate, it’s a ceiling: the best year your system might ever have, quoted as if it were the average. The same goes for a “first year output” figure shown without any mention of degradation, or a big number on the front page that’s higher than the one on the MCS estimate page. If the wording wobbles, the maths probably does too.
What a realistic UK yield looks like in 2026
For an unshaded, south-facing roof at 30–40° pitch, in year one and before degradation, these are the bands I expect a quote to land in. They match the regional yields in our payback period guide:
| Region | South-facing, 35° (kWh per kWp) | East–west, pitched | East–west, flat roof |
|---|---|---|---|
| South England & South West | 950–1,050 | 760–890 | 820–945 |
| Midlands & Wales | 850–950 | 680–810 | 730–855 |
| North England & Northern Ireland | 800–900 | 640–765 | 690–810 |
| Scotland | 750–850 | 600–720 | 645–765 |
Bands, not table values: MCS splits the UK into more zones than this, so your exact Kk will differ a little. The east–west columns apply the 80–85% (pitched) and 86–90% (flat roof) orientation indices to the south-facing range.
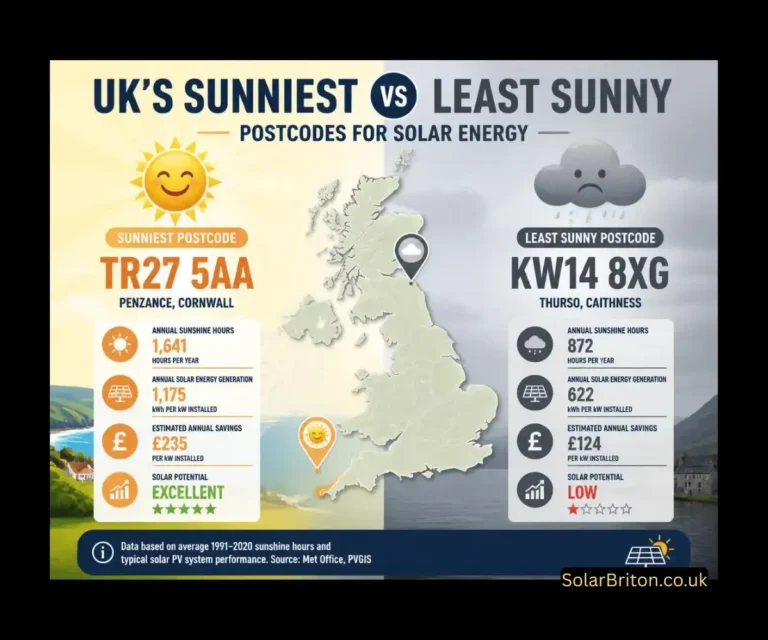
Postcode matters more than people think, though less than the sunshine-hours league tables suggest. Scottish yields run roughly 15–20% below the south coast, which is enough to change your payback by a couple of years. I keep a note of the UK’s sunniest and least sunny postcodes handy when a quote lands.
Realistic yield bands, and one quote that forgot where it was
First-year kWh per kWp for an unshaded roof. Bars show the band for each region and roof type. The red marker is an illustrative inflated claim, not a real quote.
My rule: if a quote’s implied yield sits more than about 5% above the top of your regional band, ask why. Above 1,100 kWh/kWp almost anywhere in the UK, I want to see the inputs behind it, not a summary of them.
Orientation, tilt and the shading tax
South at 30–40° is the benchmark everything else is measured against. Once your roof points somewhere else, the yield slides, and a quote that ignores that slide is inflated by omission, even if nobody meant it. These indices come from MCS-style irradiance data and PVGIS modelling, and they’re the same ones we use in our guide to east–west solar arrays:
| Roof facing | Typical yield vs south-facing at 35° (south = 100%) |
|---|---|
| South | 100% |
| South-east / south-west | 93–96% |
| East-west flat-roof array (10–15° tilt) | 86–90% |
| West only | 81–85% |
| East-west split, pitched | 80–85% |
| East only | 79–83% |
| North | 50–60% |
North-east and north-west faces sit between the east–west and north figures, so ask for the Kk for your exact angle. If you’re weighing up a north slope, our north-facing roof guide goes through when it still makes sense.
East–west roofs aren’t the disaster folklore makes them. They lose peak output but gain a long, flat generation curve that suits people home in the mornings and evenings, and a split roof can still beat a small south slope on total kWh because you can fit more panels.
Shading is the silent tax, and it costs more than the shaded area suggests. On a basic string system, a shadow over one panel can drag the whole string down; our underperforming panels guide gives an example where shading just 10% of a panel cuts a string’s output by 30–40%. Optimisers or microinverters contain that damage to the shaded panel alone, which is exactly what our micro inverter vs string inverter comparison digs into. If your survey shows shading but the design has no mitigation, ask how the shade factor was worked out and what it assumes about the inverter set-up.
How yields get inflated (usually by accident)
Outright invention is rarer than carelessness. Because the MCS method is just kWp × Kk × shade factor, there are only a few places for an error to creep in. Here’s the usual list, roughly in the order I meet it:
- The wrong roof direction. The orientation stays at south because nobody changed the dropdown, so an east–west roof gets a south-facing Kk.
- The template postcode region. The Kk row never gets updated from head office’s home patch, so a roof in Essex quietly borrows a sunnier region’s number.
- A shade factor of 1.00 over a chimney or tree. The survey photos show the problem, the estimate page doesn’t.
- A different number on the front page. Sales software, brochure maths (panel wattage multiplied by sunshine hours in somebody’s head) or a simulation tool gives a rosier figure than the MCS estimate page. The MCS number is the one that should match the contract.
- “Up to” and “first year” weasel words. A ceiling or a best case standing in for an average.
- Payback pressure. A bigger yield means a shorter payback means a signature today. Sometimes that one is deliberate.
None of this changes what your roof will actually produce. It only changes what you believed on the night you signed. Several of these tricks overlap with the wider patterns in our seven red flags of UK solar scams.
Cross-check the number yourself
- Check the inputs first. Open the estimate page and confirm the postcode region, orientation, pitch and shade factor describe your roof. A compass app and a look at your survey photos take two minutes.
- Run PVGIS yourself. The European Commission’s free PVGIS tool lets you drop a pin on your roof, set the slope and azimuth, and model 1 kWp. Set the system losses to 20% so it mirrors MCS’s 0.8 performance ratio. Expect a sensible quote to land within roughly 5–10% of what PVGIS gives you, because the two use different weather datasets.
- Compare three quotes on implied yield, not headline kWh. Different firms quote different sizes. Normalise everything to kWh/kWp and the outlier walks out of the page on its own.
- After install, hold them to it. Your paperwork should carry the same estimate, and a decent monitoring setup lets you check year one against it. Compare against the same week last year, never last month. A sustained drop of 5% or more over two to three weeks of normal weather is worth investigating, and a consistent shortfall of 15% or more on clear days points to a fault, not a mood. Allow for a dull year, but a persistent gap against a normal-weather year is a conversation to have with your installer, and my underperforming panels guide is where I’d start.
Ten minutes, free, and it turns a twelve-page PDF into one comparable number. There’s no good reason to skip it.
If the number doesn’t survive contact
- Email, don’t phone. Ask for the inputs in writing: postcode region, orientation, pitch, Kk, shade factor and the shading survey. Written questions get written answers, and written answers are evidence.
- Ask for the design pack. A site survey record and sunpath diagram show whether somebody actually looked at your chimneys or guessed from a satellite thumbnail.
- Get competing quotes from certified firms. My guide to choosing a solar installer covers how to shortlist, and our Find an Installer page lists MCS-certified companies by region.
- Check the certification is current, not just claimed on a van door. Search the company on the official MCS finder.
- Know your exit rights. If you agreed the contract at home, by phone or online, you can usually cancel for any reason within 14 days (day one is the day after you sign), and the window stretches if you were never given proper cancellation details. Our guide on how to cancel a solar panel contract has the counting rules and a letter you can copy. Past that, an inflated promise can amount to mis-selling, and unwinding the contract within 90 days may still be possible, so check whether you were mis-sold before those rights expire.
Here’s the tell: a good installer enjoys this email. It’s their language, and answering it properly is half an hour of work they’d rather do than lose a customer to a cowboy. A bad one goes quiet, or gets offended. Silence is your answer.
Turning the estimate into money
The estimate is only half the money story. What you keep depends on how much of that generation lands while you’re home using it. A typical household without a battery uses around half of what its roof makes and exports the rest. Add a battery and the self-use share rises to around 80%.
A unit you use yourself saves roughly 26p at the October 2026 price cap (see our price cap guide). Exported units earn Smart Export Guarantee rates, roughly 4p to 15p per kWh on most open tariffs, with a few tied or time-of-use deals paying more. That’s why I keep a live comparison of the best SEG tariffs, and why I’d run a quote’s export figure through our SEG income estimator rather than trusting the savings column of a sales PDF. The GOV.UK SEG guidance spells out what suppliers will ask to see.
Here’s what an inflated yield does to that sum. Take Examples A and B above, with 50% self-use, 26p for self-used units and 7p for exports:
| Example | Annual kWh | Self-used (50%) | Exported (50%) | Yearly value | Payback on £7,000 |
|---|---|---|---|---|---|
| A: honest estimate | 3,500 | £455 | £123 | about £578 | about 12 years |
| B: inflated estimate | 4,800 | £624 | £168 | about £792 | about 9 years |
Illustrative sums using the same assumptions as our homepage figures. Your self-use share, tariffs and system price will differ.
That’s roughly £215 a year of savings that exist only on paper, and three years of payback that vanish when the roof does what roofs do. Keep the policy clock in mind too. The 0% VAT rate on domestic solar and battery installation runs to 31 March 2027, and what happens to solar VAT in April 2027 changes the maths on waiting for a better price.
And sanity-check the package price while you’re at it. I’ve written about what MCS data says a 4 kWp system should actually cost, because an inflated yield and an inflated price usually travel in the same van. Payback maths only works when both numbers are honest.
My ten-minute quote check
- Divide claimed kWh by kWp and compare the result to your regional band.
- Confirm the estimate page lists postcode region, orientation, pitch, Kk and shade factor.
- Check the orientation and pitch match your actual roof.
- Check any shade factor below 1.00 comes with a shading survey, and that a shaded roof doesn’t show 1.00.
- Search the PDF for “up to” and “first year”, and compare the front-page figure with the MCS estimate page.
- Run PVGIS at 1 kWp for your roof with 20% losses and compare within 5–10%.
- Confirm the installer’s MCS certification is current.
- Get two more quotes and normalise all three to kWh/kWp.
None of this needs an engineering degree. It needs a calculator, ten minutes and the willingness to send one slightly awkward email. Do it anyway. A yield estimate is a promise about maths, not weather, and if the maths holds up, the rest of the quote usually does too.
FAQs
Is the MCS performance estimate a guarantee of what my panels will produce?
No. It’s an estimate worked out with the MCS standard method (system size in kWp × the Kk yield factor × the shade factor) for an average year, not a promise. Weather alone can move real output by up to about 10% either way from one year to the next, and panels fade by around half a percent a year after the first. What you can fairly hold the installer to is the inputs: the right postcode region, orientation, pitch and shading for your roof. If a normal-weather year comes in far below the figure, that’s a design or installation conversation, not bad luck.
What kWh per kWp should a decent UK solar quote show?
For an unshaded south-facing roof at 30–40° pitch, expect roughly 950–1,050 kWh per kWp a year in southern England and the South West, 850–950 in the Midlands and Wales, 800–900 in northern England and Northern Ireland, and 750–850 in Scotland. A pitched east–west roof delivers about 80–85% of those figures. If the implied yield sits more than about 5% above the top of your regional band (above 1,100 kWh/kWp almost anywhere), ask the installer to show the Kk, orientation, pitch and shade factor behind it before you sign anything.
What should I do if my quote’s yield looks inflated?
Ask the installer, in writing, for the inputs behind the number: postcode region, orientation, pitch, Kk, shade factor and the shading survey. A good firm can answer in minutes. Then run PVGIS on your roof with system losses set to 20% and compare. If they can’t or won’t explain the gap, get two more quotes from MCS-certified installers and compare the implied kWh/kWp on each. If you’ve already signed at home, by phone or online, you can usually cancel within 14 days of the day after signing. After that, check whether you were mis-sold, because unwinding the contract within 90 days may still be possible.