
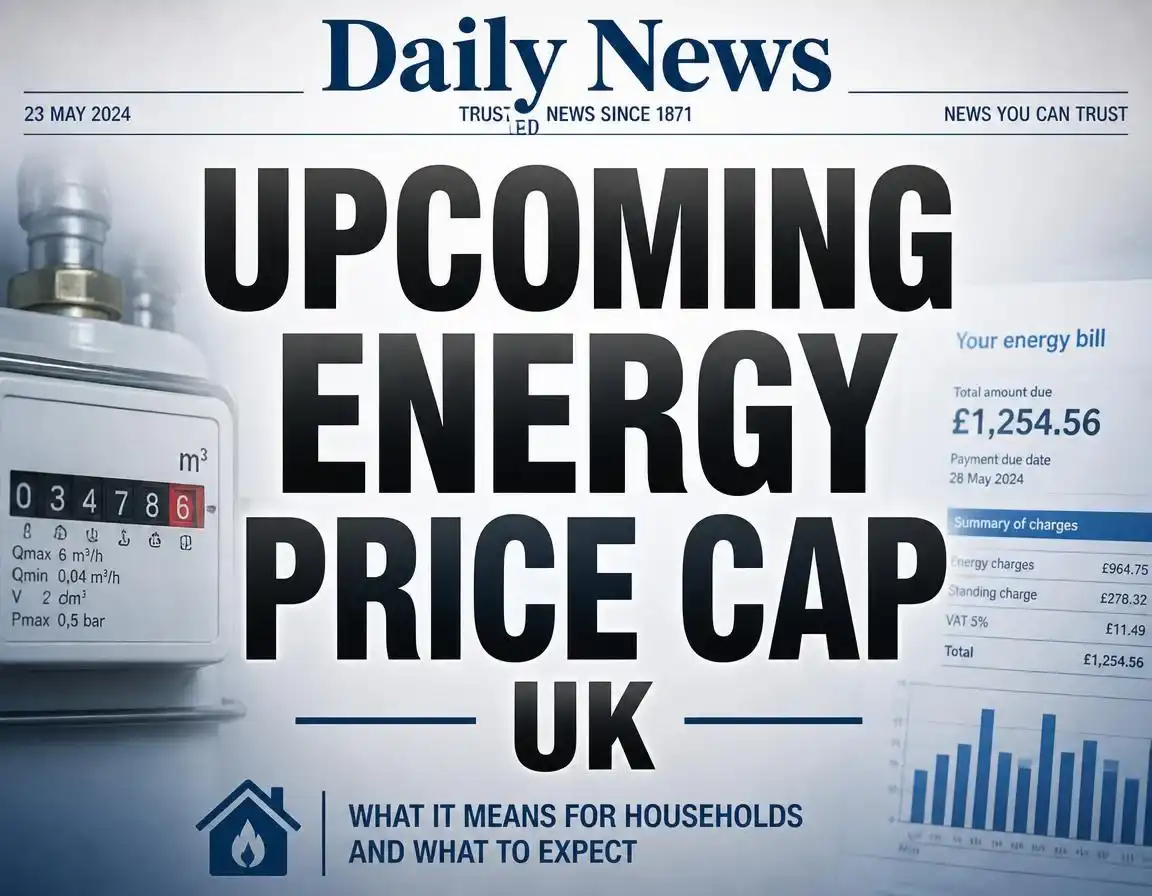
Energy Price Cap October 2026

Energy Price Cap October 2026: What It Means for Solar Payback
I get some version of this question most weeks: “my bill’s about to change again in October, so is it still worth putting panels on my roof?” Fair question. So here’s the honest answer — the actual price cap numbers, the latest October forecast, and a worked example showing exactly what it does to your solar payback. No padding, just the figures.
The price cap everyone’s paying right now (July to September 2026) is £1,862 a year for a typical dual-fuel home on Direct Debit. The latest forecast for October to December, from Cornwall Insight, actually points to a small fall to around £1,849 — though Ofgem won’t confirm the real number until 26 August 2026, so treat it as a forecast, not a fact. Either way, unit rates are still sitting well above where they were back in April, which means solar panels installed today pay themselves back in roughly the time they have done since the summer — about 10 to 11 years for a typical 4kWp system without a battery.
What’s actually confirmed for October 2026 (and what’s still just a forecast)
Right, quick refresher on how this works, because it trips a lot of people up. Ofgem — the energy regulator — resets the price cap every three months: January, April, July and October. It doesn’t cap your actual bill, it caps the rate suppliers can charge per unit of gas and electricity, plus the daily standing charge. Use more energy, pay more. Simple enough.
The cap running right now, from 1 July to 30 September 2026, sits at £1,862 a year for a typical dual-fuel household paying by Direct Debit — a hefty 13% jump from April’s £1,641. That works out at 26.11p per kWh for electricity and 7.33p per kWh for gas, with standing charges of 57.19p and 29.04p a day. You can check the full breakdown yourself on Ofgem’s official announcement.
Now, the bit everyone actually wants to know: what happens in October? As of writing, nothing is confirmed. Ofgem has to announce the October to December cap by 26 August 2026, and it’s calculated from wholesale market data gathered between 19 May and 18 August 2026 — a window that’s still open. The most recent forecast, published by Cornwall Insight on 30 June 2026, puts the October cap at roughly £1,849 a year, a small fall of about 0.5% on the current level. That’s eased back from an earlier estimate of £1,899 made in May, as a temporary US–Iran ceasefire took some heat out of wholesale gas prices.
💡 Two numbers, same cap — don’t let it confuse you
You’ll sometimes see the July cap quoted as £1,862 and other times as £1,663. Both are correct. Ofgem updated its definition of a “typical household” from July 2026 to reflect the fact that we’re all using a bit less gas and electricity than we used to (7% less electricity, 17% less gas versus the last review in 2023). £1,862 uses the old usage assumptions; £1,663 uses the new, lower ones. Same unit rates, same standing charges — just a different notional household size doing the sums. The October forecast has the same split: roughly £1,849 under the old assumptions, or about £1,654 under the new ones.
| Period | Electricity rate | Electricity standing charge | Gas rate | Gas standing charge |
|---|---|---|---|---|
| Jan–Mar 2026 | 27.69p/kWh | 54.75p/day | 5.93p/kWh | — |
| Apr–Jun 2026 | 24.67p/kWh | 57.21p/day | 5.74p/kWh | 29.09p/day |
| Jul–Sep 2026 (current) | 26.11p/kWh | 57.19p/day | 7.33p/kWh | 29.04p/day |
| Oct–Dec 2026 | Not yet published — confirmed by Ofgem on or before 26 August 2026 | |||
Why does the October forecast keep moving around?
Because wholesale gas and electricity prices are the biggest single ingredient in the cap — roughly 40–45% of a typical bill — and wholesale markets have had a properly bumpy year. The Middle East conflict that flared up in early 2026 disrupted supply through the Strait of Hormuz, a shipping route that carries around a fifth of the world’s oil and gas, and that’s what pushed July’s cap up so sharply. A ceasefire since then has calmed things down a little, which is why the October forecast has actually eased back rather than climbed further. But nobody’s pretending it’s settled — there’s still a good six weeks of the assessment window left to run, and any escalation, cold snap, or currency swing could nudge the final number either way.
What a flat (or rising) price cap actually does to your solar payback
Here’s the actual connection, in plain terms: every solar panel you own is quietly competing against your electricity unit rate. When you use your own generated power instead of buying it from the grid, you save whatever the unit rate happens to be. So when the cap goes up, your own solar power effectively gets more valuable — and your payback period gets shorter. When the cap falls, it’s the opposite, though never dramatically, because the cap simply hasn’t moved by huge amounts quarter to quarter.
Let’s put real numbers on it rather than just asserting it. Take a standard 4kWp system, no battery, £7,000 fully installed, generating around 4,000 kWh a year. Assume you use half of that yourself and export the other half, earning a typical Smart Export Guarantee (SEG) rate of 7p/kWh on the exported half:
| Price cap period | Import rate | Bill saving/yr | SEG income/yr | Total benefit/yr | Simple payback |
|---|---|---|---|---|---|
| April 2026 cap | 24.67p/kWh | £493 | £140 | £633 | ~11.0 years |
| July 2026 cap (current) | 26.11p/kWh | £522 | £140 | £662 | ~10.6 years |
| October 2026 (forecast) | ~flat vs July* | ~£515–£522 | £140 | ~£655–£662 | ~10.6–10.7 years |
*The exact October unit rate split hasn’t been published yet — only the headline forecast bill has. But because that headline figure is forecast to land within 1% of July’s, a system installed today should pay back in almost exactly the same time as it would under the current cap.
Two things worth flagging so you don’t take this further than it goes. First, a battery changes the sum: it pushes self-consumption up towards 70–80%, which increases your annual saving, but the extra £3,500–£5,000 upfront cost usually adds two to three years back onto payback — our battery storage cost guide breaks that down properly. Second, SEG rates aren’t set by the price cap at all — they’re set individually by suppliers, currently ranging from about 4p to 15p per kWh, so it genuinely pays to shop around rather than assume you’re stuck with whatever your supplier first offers. Our SEG income estimator will show you what your own export income could look like, and it’s worth comparing that against what Octopus Energy’s export tariff and other 2026 deals are paying before you commit.
2026 solar costs and payback at a glance
For context, here’s where the wider cost and payback picture sits right now across common system sizes, using the same assumptions as above (roughly 50% self-consumption, 26p/kWh import rate, 7p/kWh SEG) — in line with the current price cap rather than any October guesswork.
| System size | Without battery | With battery | Annual saving (est.) | Payback period |
|---|---|---|---|---|
| 3 kWp | ~£5,500 | ~£9,500 | ~£600/yr | 9–11 yrs |
| 4 kWp | ~£7,000 | ~£11,000 | ~£820/yr | 8–10 yrs |
| 5 kWp | ~£8,500 | ~£12,500 | ~£1,010/yr | 8–10 yrs |
| 6 kWp | ~£10,000 | ~£14,000 | ~£1,220/yr | 8–11 yrs |
Want the numbers for your actual roof rather than a national average? Run them through our free solar panel calculator — it takes your usage and roof details and gives you a proper personalised payback estimate rather than a rough rule of thumb. There’s a full cost breakdown by component over on our solar panel cost pages too.
Should you wait for the official October announcement before going solar?
Honestly, probably not, and here’s why. Even in the best case for waiting — the cap falling further than currently forecast — the difference to your payback period would be marginal, a matter of months, not years, based on the maths above. What genuinely does move the needle is the 0% VAT rate on residential solar and battery installations, which runs out on 31 March 2027. That alone is worth £1,000–£2,850 on a typical system, and standard 5% VAT is scheduled to return the day after. Compared with that, waiting six weeks for Ofgem’s confirmation to shave a few pounds off your unit rate assumptions doesn’t really stack up.
If cash flow is the real sticking point rather than timing, it’s worth knowing you don’t have to find the full amount upfront — our guide to solar panels with no upfront cost runs through the finance routes available in 2026. And if you want to check exactly what grants and VAT savings you personally qualify for before getting quotes, our grant and VAT savings checker takes about two minutes.
The quick recap
- The current price cap (July–September 2026) is £1,862 a year for a typical home — a 13% rise on April.
- October’s cap isn’t confirmed yet. Ofgem announces it by 26 August 2026; the latest forecast points to a small fall to around £1,849.
- Unit rates remain well above April’s levels, whatever happens in October — that’s the bit that actually matters for solar maths.
- A 4kWp system installed today pays back in roughly 10 to 11 years without a battery, based on current and forecast rates.
- SEG export income is separate from the price cap and varies by supplier — always worth shopping around.
- The 0% VAT deadline (31 March 2027) is the date that actually affects your numbers, far more than the October cap announcement will.
Your questions answered
When will Ofgem confirm the October 2026 price cap?
Ofgem has to confirm the October to December 2026 price cap by 26 August 2026. The figure is based on wholesale market data collected between 19 May and 18 August 2026, so until the official announcement, any October number you see quoted, including the ones on this page, is a forecast rather than a confirmed figure.
Is the energy price cap going up or down in October 2026?
Based on the latest forecast from Cornwall Insight, updated 30 June 2026, the October to December 2026 cap is expected to fall slightly, by around 0.5%, from £1,862 a year to roughly £1,849 a year for a typical dual-fuel household paying by Direct Debit. That is still around £200 higher than the April 2026 cap of £1,641, so bills remain well above where they were earlier in the year, even with a small autumn dip.
Does the energy price cap affect how quickly solar panels pay for themselves?
Yes. A higher electricity unit rate makes every kWh of solar power you use yourself worth more, which shortens your payback period, while a lower rate stretches it out. Because the October 2026 forecast is close to flat compared with July, the payback period for a typical 4kWp solar system installed now should stay close to where it has been since the summer, around 10 to 11 years without a battery, rather than shifting much either way.



5 Comments